In the previous section, we completed a discussion on linear inequalities in two variables. In this section, we will see the method for solving a system of linear inequalities in two variables. Here also, we will be using the graphical method. We will learn the method through some examples.
Solved example 6.13
Solve the following system of linear equations graphically.
x+y ≥ 5
x-y ≤ 3
Solution:
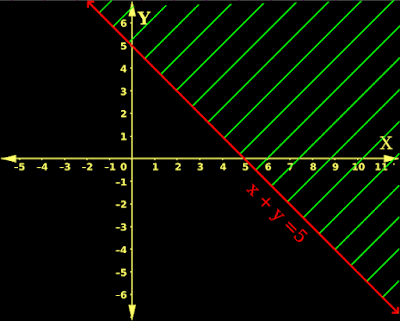
1. Based on the discussions in the previous two sections, we know how to draw the area which will satisfy x+y ≥ 5
• It is the area hatched with green lines in fig.6.15 below:
 |
| Fig.6.15 |
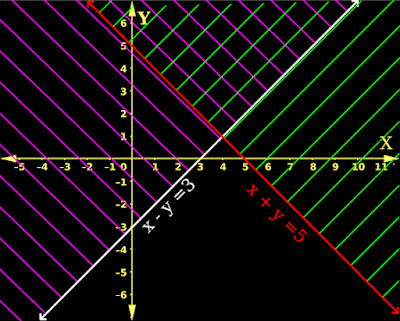
2. Next step is to plot the graph of x-y = 3 on the same fig. It is shown in fig.6.16 below:
 |
| Fig.6.16 |
3. The final step is to hatch the area which will satisfy x-y ≤ 3 on the same fig.
•This hatching is done using magenta lines as shown in fig.6.17 below:
 |
| Fig.6.17 |
• In fig.6.17 above, there are two types of areas:
(i) The area hatched with green lines.
(ii) The area hatched with magenta lines.
◼ The double hatched region which is common to the above two hatched regions is the solution area of the given system of inequalities.
♦ Mark any point in the solution area.
♦ Note down the x and y coordinates of that point.
♦ Those x and y coordinate values will satisfy both the inequalities in the given system.
4. Some important points can be noted:
(i) We know that the green hatched area is an infinite area. The magenta hatched area is also an infinite area. Consequently, the double hatched area will be an infinite area.
(ii) The point of intersection of the red and white lines will give the solution of the system of equations:
x+y = 5
x-y = 3
(iii) The area of intersection of the green and magenta hatches, will give the solution area of the system of inequalities:
x+y ≥ 5
x-y ≤ 3
Solved example 6.14
Solve the following system of linear equations graphically.
5x+4y ≤ 40
x ≥ 2
y ≥ 3
Solution:
1. Based on the discussions in the previous two sections, we know how to draw the area which will satisfy 5x+4y ≤ 40
• It is the area hatched with green lines in fig.6.18 below:
 |
| Fig.6.18 |
2. Next step is to plot the graphs of x = 2 and y = 3 on the same fig. They are shown as cyan and white lines in fig.6.19 below:
 |
| Fig.6.19 |
3. The next step is to hatch the area which will satisfy x ≥ 2 on the same fig.
• This hatching is done using magenta lines as shown in fig.6.20 below:
 |
| Fig.6.20 |
3. The final step is to hatch the area which will satisfy y ≥ 3 on the same fig.
• This hatching is done using orange lines as shown in fig.6.21 below:
 |
| Fig.6.21 |
• In fig.6.21 above, there are three types of areas:
(i) The area hatched with green lines.
(ii) The area hatched with magenta lines.
(ii) The area hatched with orange lines.
◼ The triple hatched region which is common to the above three hatched regions is the solution area of given system of inequalities.
♦ Mark any point in the solution area.
♦ Note down the x and y coordinates of that point.
♦ Those x and y coordinate values will satisfy all three inequalities in the given system.
4. Some important points can be noted:
(i) We know that the green hatched area is an infinite area. The magenta and orange hatched areas are also an infinite areas. But the triple hatched area is bounded by the red, cyan and white lines. It is a finite area.
(ii) The point of intersection of the red and cyan lines will give the solution of the system of equations:
5x+4y = 40
x = 2
• The point of intersection of the red and white lines will give the solution of the system of equations:
5x+4y = 40
y = 3
• The point of intersection of the cyan and white lines will give the solution of the system of equations:
x = 2
y = 3
(iii) The area of intersection of the green, magenta and orange hatches, will give the solution area of the system of inequalities:
5x+4y ≤ 40
x ≥ 2
y ≥ 3
• In many practical situations, x and y will represent quantities like cost of items, number of items purchased, number of hours worked by employees, etc.,
• In such cases, x and y cannot be -ve.
♦ This fact can be written mathematically as: x ≥ 0 and y ≥ 0
• We know that, if x both x and y are greater than or equal to zero, it has to be the first quadrant.
• So we can write:
If x ≥ 0 and y ≥ 0, then the solution area will lie some where in the first quadrant.
Solved example 6.15
Solve the following system of linear equations graphically.
8x+3y ≤ 100
x ≥ 0
y ≥ 0
Solution:
1. Based on the discussions in the previous two sections, we know how to draw the area which will satisfy 8x+3y ≤ 100
• It is the area hatched with green lines in fig.6.22 below:
 |
| Fig.6.22 |
2. We see that, the green hatched lines are present in all the four quadrants.
• But it is given that, both x and y are greater than or equal to zero. So only the green hatch in the first quadrant is acceptable.
• Thus the required solution area is the area hatched by green lines in fig.6.23 below:
 |
| Fig.6.23 |
Solved example 6.16
Solve the following system of linear equations graphically.
x+2y ≤ 8
2x+y ≤ 8
x ≥ 0
y ≥ 0
Solution:
1. In the fig.6.24 below,
♦ the solution area of x+2y ≤ 8 is hatched with green lines.
♦ the solution area of 2x+y ≤ 8 is hatched with magenta lines.
 |
| Fig.6.24 |
2. We see that, the double hatch is present in all the four quadrants.
• But it is given that, both x and y are greater than or equal to zero. So only the double hatch in the first quadrant is acceptable.
• Thus the required solution area is the double x hatched area in fig.6.25 below:
 |
| Fig.6.25 |
The link below gives some more solved examples:
• In the next section, we will see some miscellaneous examples.
Copyright©2022 Higher secondary mathematics.blogspot.com
No comments:
Post a Comment