In the previous section, we completed a discussion on the Derivative test which help us to find whether a given function is increasing or decreasing. In this section, we will see Tangents and Normals.
Some basic details can be written in 9 steps:
1. In analytic geometry classes, we saw that:
Equation of a straight line passing through (x0,y0) is given by
y – y0 = m(x – x0)
♦ Here m is the slope of that straight line.
2. So if we know the slope m, we can easily write the equation of the straight line passing through any given point (x0,y0).
3. Now consider a curve given by y = f(x).
• We have seen numerous curves of this type, in the previous sections.
• For example, f(x) = x3 – 3x2 + 3 is a curve.
• If we want to plot that curve on the xy-plane, we can write:
y = x3 – 3x2 + 3
4. Mark some random points on any given curve. Draw tangents through each of those points. We know that, no two tangents will be the same. This is because each tangent will have it’s own slope.
5. Suppose that, we want a tangent at a particular point (x0,y0).
• Based on (1) and (2) above, we can easily draw that tangent if we know the slope of the tangent at (x0,y0)
• But the slope of the tangent at (x0,y0) is f'(x0).
• So the equation of the required tangent is:
y – y0 = f'(x0)(x – x0)
6. Now we can write the equation of the normal also at (x0,y0).
• For that, we make use of the following fact:
Slope of the perpendicular line is the negative reciprocal of the slope of the original line.
• We can write:
Equation of the required normal is:
$\rm{y - y_0 \,=\,\frac{-1}{f'(x_0)} (x - x_0)}$
7. Suppose that, f'(x0) = 0
• Then it means that, the tangent at (x0,y0) is parallel to the x-axis.
• In such a situation, we can straight away write the equation of the tangent at (x0,y0) as: y = y0
8. Suppose that, f'(x0) tends to ∞.
• Then it means that, the tangent at (x0,y0) tends to be parallel to the y-axis.
• In such a situation, we can straight away write the equation of the tangent at (x0,y0) as: x = x0
9. The following information will be very useful while solving some types of problems. It can be written in 2 steps:
(i) If 𝜃 is the angle which a straight line makes with the +ve direction of the x-axis, then slope of that straight line will be equal to tan 𝜃. (We saw this in analytic geometry classes)
(ii) So we can write:
If the tangent at (x0,y0) makes an angle 𝜃 with the +ve direction of the x-axis, then f'(x0) = tan 𝜃.
Now we will see some solved examples:
Solved example 22.14
Find the slope of the tangent to the curve y = x3 − x at x = 2
Solution:
• Slope of the tangent at x = 2 is $\rm{\left. \frac{dy}{dx} \right |_{x = 2}}$
• It can be calculated as shown below:

• The graphs are shown in fig.22.14 below.
♦ The curve is drawn in red color.
♦ The tangent at x = 2 is drawn in green color.
 |
| Fig.22.14 |
• We see that, slope of the green line is 11.
Solved example 22.15
Find the point at which the tangent to the curve $\rm{y = \sqrt{4x – 3} ~-~1}$ has its slope $\rm{\frac{2}{3}}$.
Solution:
1. The derivative can be used to find the slope of tangent at any point. So we will first find the derivative.

2. The slope must be 2/3. So we can write:

3. Equation of the curve is: $\rm{y = \sqrt{4x – 3} ~-~1}$
• When x = 3, we get:
$\rm{y = \sqrt{4(3) – 3} ~-~1}~=~2$
4. Therefore, we can write:
Mark the point (3,2) on the given curve. Draw the tangent at that point. Slope of that tangent will be 2/3.
• The graph is shown in fig.22.15 below:
♦ The curve is drawn in red color.
♦ The tangent at (3,2) is drawn in green color.
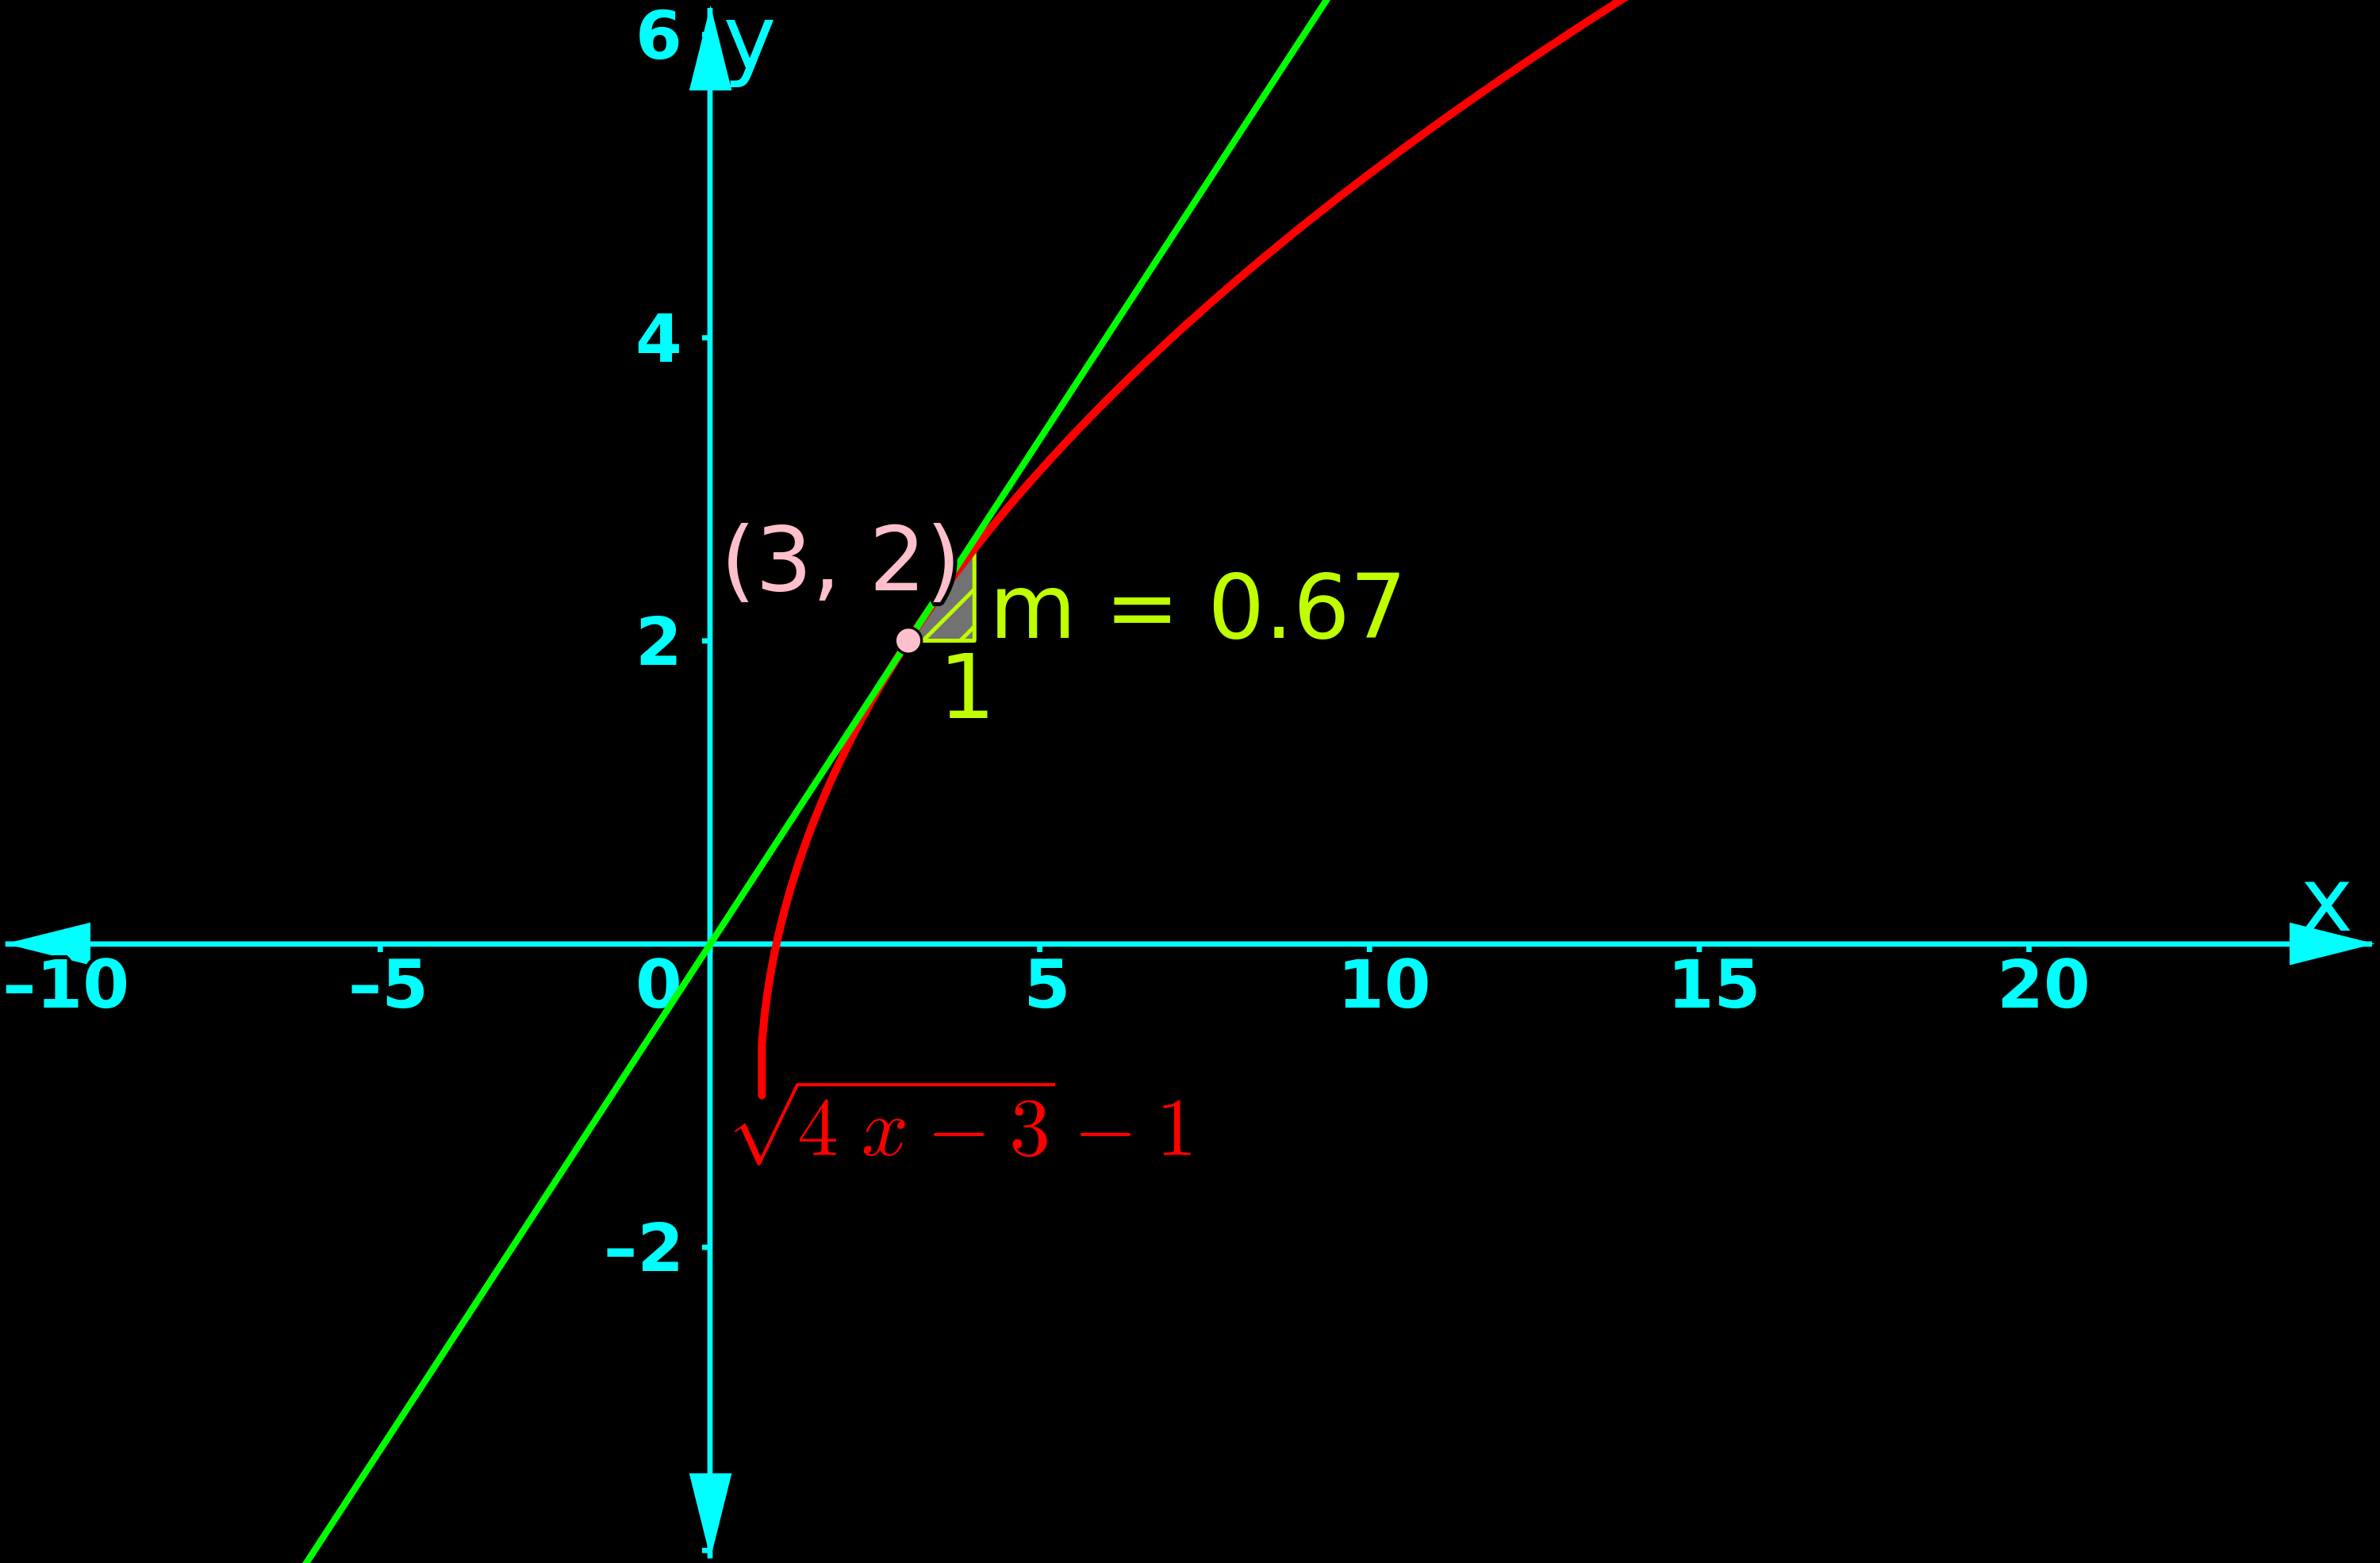 |
| Fig.22.15 |
• We see that, slope of the green line is 2/3 = 0.67
Note: In the above graph, we do not see much red curve below the x-axis. The reason can be written in 4 steps:
(i) When x = 3, we can write:
$\rm{y = \sqrt{4(3) – 3} ~-~1}~=~(\pm 3 -1)~=~2~\text{OR}~-4$
So (3, −4) is a possible point on the graph. But it is not plotted.
(ii) Another example:
When x = 7, we can write:
$\rm{y = \sqrt{4(7) – 3} ~-~1}~=~(\pm 5 -1)~=~4~\text{OR}~-6$
So (7, −6) is a possible point on the graph. But it is not plotted.
(iii) We do not plot such points. If we do, then it means that, for inputs like x = 3, 7 etc., there will be two outputs.
• If there are two outputs, we cannot call it a function.
(iv) So we restrict the output values (range).
Solved example 22.16
Find the equation of all lines having slope 2 and being tangent to the curve $\rm{y + \frac{2}{x - 3}~=~0}$.
Solution:
1. The derivative can be used to find the slope of tangent at any point. So we will first find the derivative.

2. The slope must be 2. So we can write:

3. Equation of the curve is: $\rm{y + \frac{2}{x - 3}~=~0}$
• When x = 4, we get:
$\rm{y = \frac{2}{3 - x}~=~\frac{2}{3 - 4}~=~-2}$
• When x = 2, we get:
$\rm{y = \frac{2}{3 - x}~=~\frac{2}{3 - 2}~=~2}$
4. Therefore, we can write:
There are two points (4,−2) and (2,2). Mark those two points on the given curve. Draw the tangent at each of those points. The two tangents will be parallel to each other with a slope of 2.
• The graph is shown in fig.22.16 below:
♦ The curve is drawn in red color.
♦ The tangents are drawn in green color.
 |
| Fig.22.16 |
• We see that, slope of the green lines is 2
5. Now we want the equation of the two tangents. We can use the general equation:
y – y0 = m(x – x0)
• So the equation of the tangent through (2,2) is:
y – 2 = 2(x – 2)
⇒ y − 2 = 2x − 4
⇒ y − 2x + 2 = 0
• Similarly, the equation of the tangent through (4,−2) is:
y – (−2) = 2(x – 4)
⇒ y + 2 = 2x − 8
⇒ y − 2x + 10 = 0
Solved example 22.17
Find points on the curve $\rm{\frac{x^2}{4}\,+\,\frac{y^2}{25}\,=\,1}$ at which tangents are (i) parallel to x-axis (ii) parallel to y-axis.
Solution:
• The derivative can be used to find the slope of tangent at any point. So we will first find the derivative.

Part (i): Tangents parallel to x-axis
1. Consider the points where tangents are parallel to the x-axis.
• Those tangents will have a slope of zero. So we can write:


3. So the points are: (0,5) and (0,−5)
The tangents at these points are parallel to the x-axis.
• The graph is shown in fig.22.16 below:
♦ The curve is drawn in red color.
♦ The tangents are drawn in green color.
 |
| Fig.22.17 |
Part (ii): Tangents parallel to y-axis
1. Consider the points where tangents are parallel to the y-axis.
• The normals at those points will have a slope of zero. Slope of normal is the negative reciprocal of that of tangent. So we can write:

2. When y = 0, we get:

• The normals at these points are parallel to the x-axis.
• Consequently, the tangents at these points are parallel to the y-axis. They are drawn in magenta color in fig.22.17 above.
In the next section, we will see a few more solved examples.
Previous
Contents
Next
Copyright©2024 Higher secondary mathematics.blogspot.com
No comments:
Post a Comment